Recent WIC Participation
USDA's Food and Nutrition Service (FNS) regularly publishes data on WIC eligibility, participation, and coverage. Because of data sources used to estimate coverage rates, the most recent data available is from 2022, whereas the most recent participation data are available from 2024.
In 2023, an average of 6.6 million participants were served by WIC every month. WIC is a critical community support; redemption of WIC foods infused $4.4 billion into local economies in 2023. Despite an overall modest increase in participation since the beginning of the pandemic, WIC is still reaching too few eligible people. The WIC CIAO Project aims to ensure that WIC reaches all eligible families.
The below trend data are found in the National and State Level Estimates of WIC Eligibility and Program Reach in 2022.
Trends in Rate of Participation Among
Eligible Individuals (Coverage Rates)

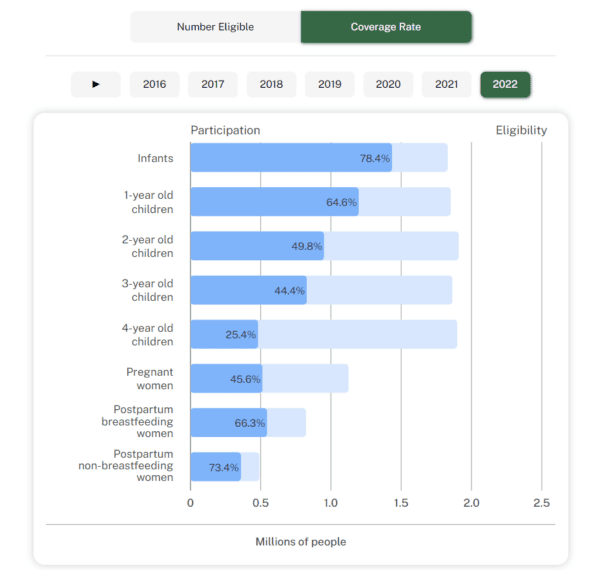
In an average month of 2022, an estimated 11.8 million people were eligible to participate in WIC. Explore how WIC eligibility and coverage rates have evolved from 2016 to 2022.
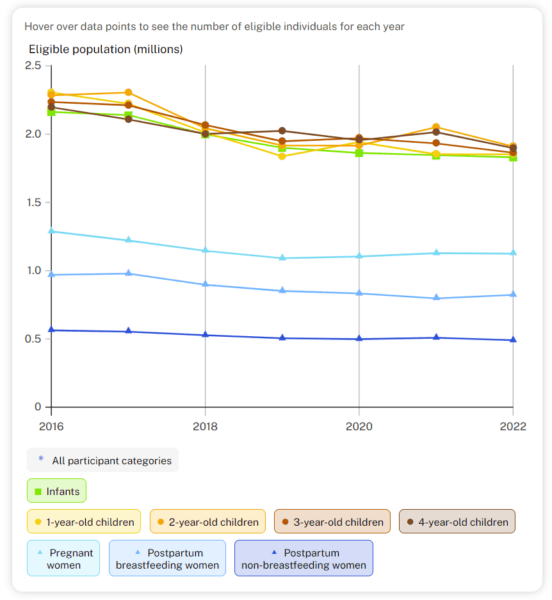
Trends in Eligibility and Participation Over Time

The overall WIC eligibility rate declined from 52 percent in 2016 to 47 percent in 2022. Understand the national trends in WIC eligibility and participation from 2016 to 2022 by participant category.
Demographic Characteristics of Eligible Infants and Children

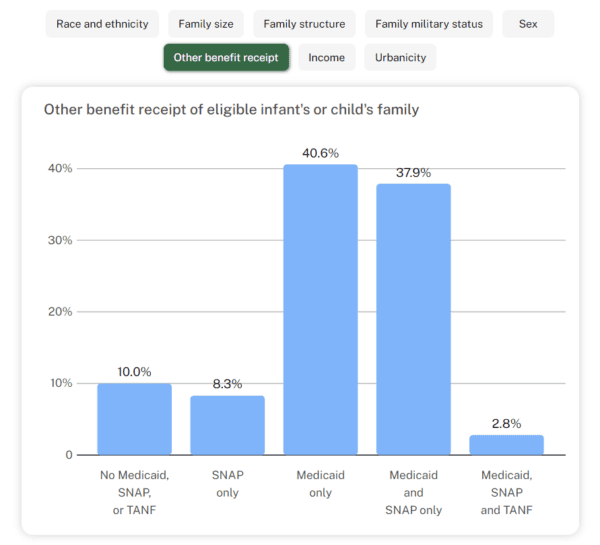
Dive into the demographic breakdown of infants and children eligible for WIC in 2022. See trends in race and ethnicity, family size and structure, gender, and other programs like SNAP and Medicaid among infants and children eligible for WIC.
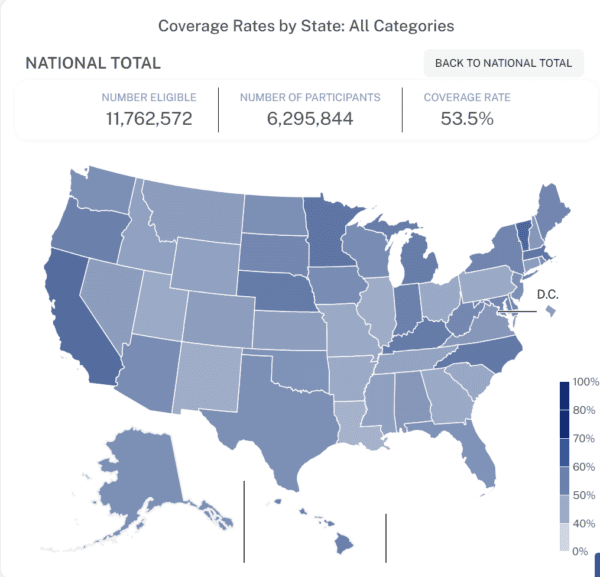
WIC Coverage Rates by State and Participation Category

The WIC coverage rate varied substantially across states, the District of Columbia, and Puerto Rico in 2022. State rates ranged from a high of 73 percent in Vermont and 80.7 percent in Puerto Rico to a low of 35 percent in Louisiana and New Mexico. Analyze WIC coverage rates across different states.
To explore more data on WIC eligibility and coverage rates in 2022, visit the USDA's interactive graphics and the full report on National and State Level Estimates of WIC Eligibility and Program Reach in 2022.
What WIC Means to Me
“I’ve been on the WIC program for a little over two months now…Everything was on the phone, and it was super easy and everyone that I talked to was super nice, the lactation consultant, the nutritionist. It’s been really helpful.”
- WIC participant

Increasing WIC Participation
The WIC Community Innovation and Outreach Project (WIC CIAO) was created to support WIC State agencies, which include 50 geographic State agencies, the District of Columbia, 33 Indian Tribal Organizations (ITOs), and five U.S. Territories that administer the Program; local WIC agencies; and nonprofit entities and organizations as they work to increase WIC awareness and participation.
